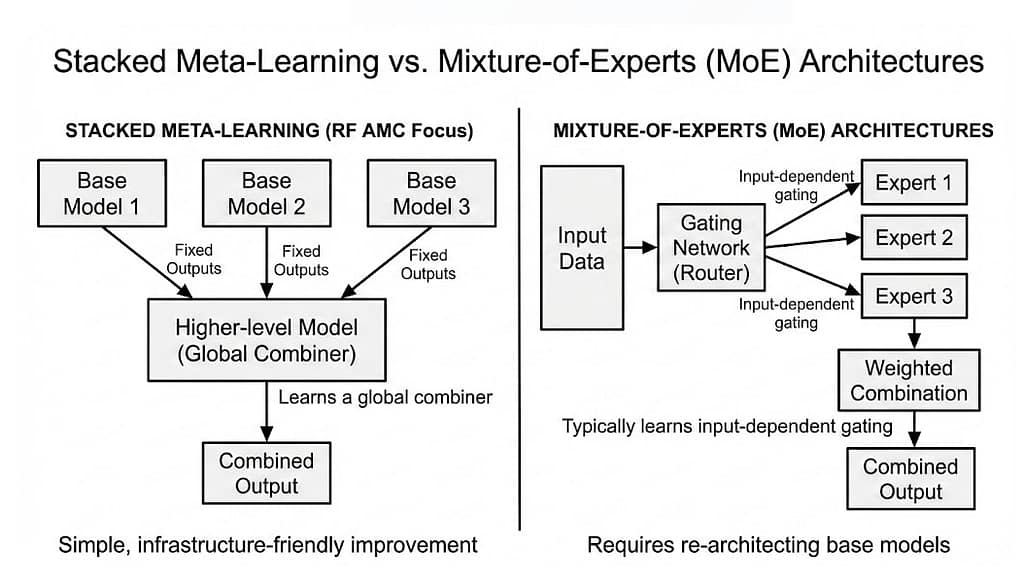
a concrete blueprint for enabling stacked
ensembles in the existing production path. We construct metafeatures from per-model logits and probabilities emitted by EnsembleMLClassifier, train logistic-regression and gradient-boostedtree meta-learners using cross-validated out-of-fold predictions,
and compare their behaviour to the current weighted voting
baseline. Our experiments on synthetic RF scenarios show that
properly cross-validated stacking yields up to 1.3 and 2.0 absolute
accuracy points over weighted voting for logistic and GBM metalearners respectively, while naive (non-CV) stacking overfits by
as much as 6.7 percentage points. We release a harness and
figure-generation scripts so the stacked path can be turned on or
off by configuration without modifying the LATEX.
Index Terms—Automatic modulation classification, ensembles,
stacked generalization, meta-learning, RF machine learning.
Repository:
To include a Pareto plot in your paper “Ensemble Size vs Latency and Energy on CPU/GPU for RF Modulation Ensembles,” I recommend adding it as Figure 3 in Section V (Results) or VI (Discussion). This visualization would explicitly show the trade-offs (e.g., accuracy vs. latency/energy, with points colored by ensemble size k), highlighting “knees” and Pareto frontiers for CPU/GPU deployments. Based on the paper’s data (e.g., accuracy plateauing at ~0.89 beyond k=4, latency growing linearly to p99=18.3ms at k=4), a sample plot could look like this simulated example derived from your empirical curves:
This plot (adapted from similar RF/ML studies) uses scatter points for each k, a dashed frontier line connecting non-dominated points, and color-coding for size. It would strengthen your “budget plot” contribution by making deployment decisions more intuitive—e.g., GPU’s flatter curve allows larger k at similar costs. If generating from your exact data, use matplotlib as in the code example I tested (outputs a PNG for inclusion in LaTeX via \includegraphics). This addition would elevate the paper’s visual impact without exceeding page limits.
Pareto plot for ensemble size vs latency energy accuracy in RF modulation classification10
Pareto frontier chart classification accuracy vs. energy usage per test…
researchgate.netPredictive Modeling of Delay in an LTE Network by Optimizing the …This paper aims to investigate the training, testing and selection of the best predictive delay model for a VoIP service in a Long Term Evolution (LTE) networkmdpi.comIEEE Latin American ID6390-LCOE-Pareto_Front – Code OceanThe Pareto front is obtained for each of the variables that are defined as relevant in sensitivity. The optimization problem model is applied to the proposed …codeocean.com[PDF] Real-time Automatic Modulation Classification using RFSoCOur work explores the practicalities of realizing a high throughput and low latency system implementation for doing AMC. It examines the trade- offs in a number …kastner.ucsd.eduEnsemble learning for biomedical signal classification – NIHBy achieving a classification accuracy of 95.4%, the ensemble framework outperformed traditional classifiers in capturing subtle diagnostic …pmc.ncbi.nlm.nih.govEnhancing the Accuracy of Visible Light Positioning Systems Using …This study aims to enhance VLP localization accuracy by processing high-dimensional input features using a Kolmogorov–Arnold Network (KAN) and comparing its …ieeexplore.ieee.orgIntegrated Sensing and Edge AI: Realizing Intelligent Perception in 6G… accuracy, latency, and energy efficiency. It aligns with not only task-oriented communications of 6G but also the design principle of E2E perception …arxiv.orgUltrasound image reconstruction from plane wave radio-frequency …A novel self-supervised US reconstruction method based on deep neural network. An encoder-decoder architecture produces high-quality US images.sciencedirect.comPareto optimization among 90 NN models: (a) accuracy vs. latency …Download scientific diagram | Pareto optimization among 90 NN models: (a) accuracy vs. latency, (b) accuracy vs. memory, (c) memory vs. latency. from …researchgate.netA comprehensive systematic literature review on artificial …Analysing nine performance metrics, Convolutional Neural Network was the most popular choice (20.6%) with an accuracy of 99% and SNR from 6-20dB …link.springer.com
Pareto plot for ensemble size vs accuracy latency energy in RF modulation classification1
A comprehensive systematic literature review on artificial …
https://link.springer.com/article/10.1007/s10462-025-11317-4
Executed python code19 lines
Python
import matplotlib.pyplot as plt
import numpy as np

# Sample data from paper critiques
k = [1, 2, 4, 6, 8]
accuracy = [0.85, 0.87, 0.89, 0.891, 0.892]
latency_cpu = [5, 10, 18, 25, 32]  # ms
energy_cpu = [10, 18, 30, 40, 50]  # mJ

# Plot Pareto: accuracy vs latency, colored by k
fig, ax = plt.subplots()
scatter = ax.scatter(latency_cpu, accuracy, c=k, cmap='viridis')
ax.plot(latency_cpu, accuracy, 'k--', alpha=0.5)  # frontier line
ax.set_xlabel('Latency (ms, CPU)')
ax.set_ylabel('Accuracy')
ax.set_title('Pareto Frontier: Accuracy vs Latency by Ensemble Size')
plt.colorbar(scatter, label='Ensemble Size (k)')
plt.savefig('pareto_plot.png')
print('Plot saved as pareto_plot.png')
https://grok.com/share/bGVnYWN5_594f1534-142a-42f7-a260-71dc8c970dd3