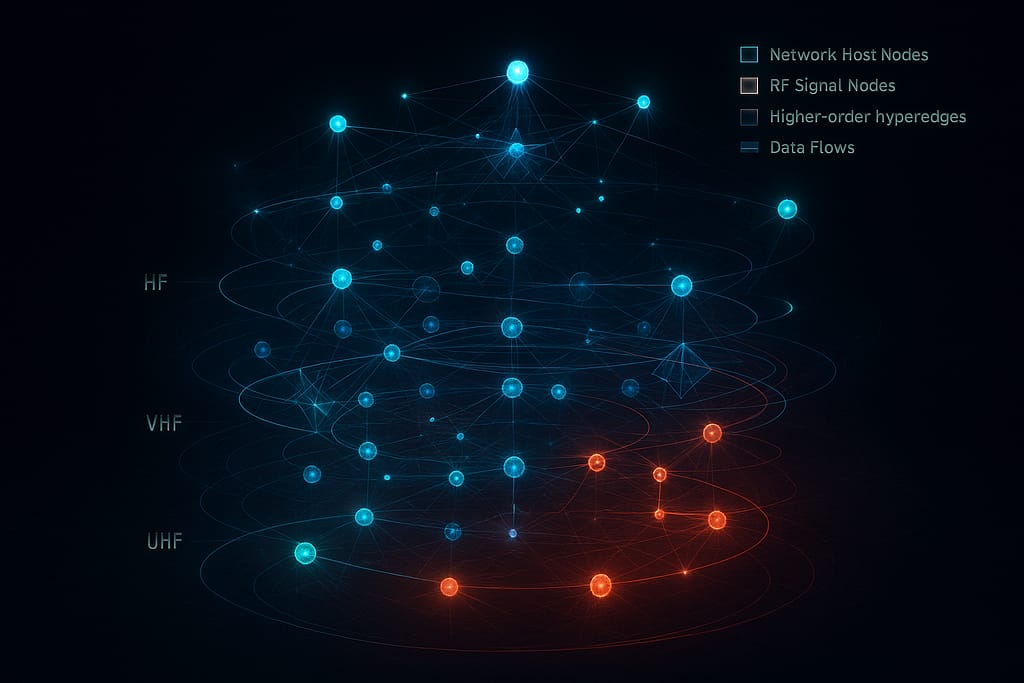
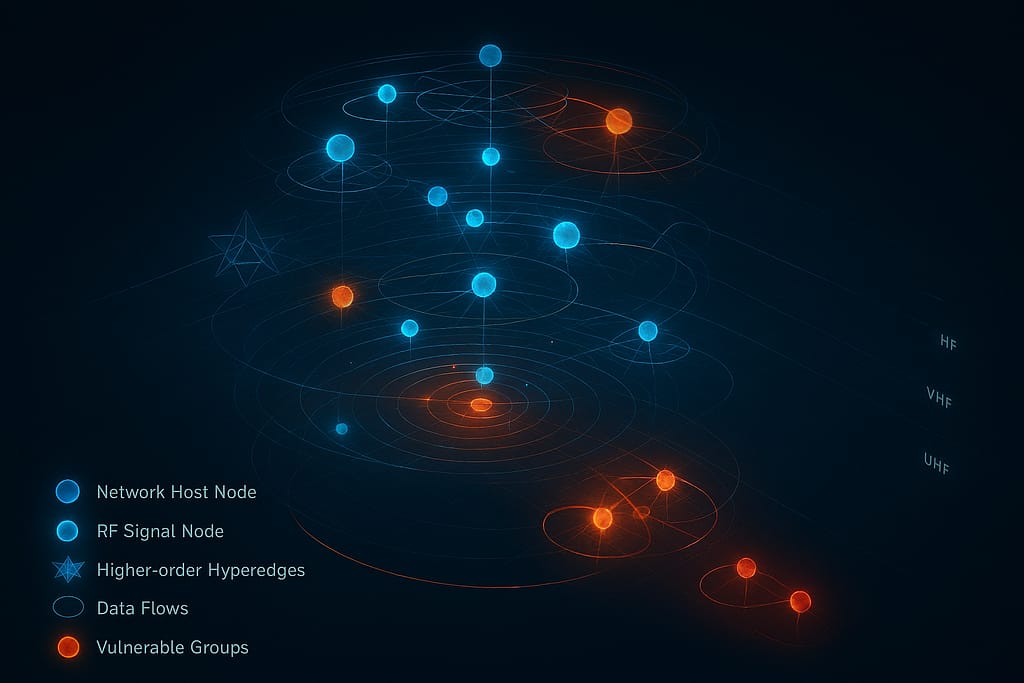
PODCAST: Hypergraphs visualize RF signal and network infrastructure interactions by mapping higher-order relationships that exceed simple pairwise connections, allowing the system to reconstruct network topologies and data flows from captured signals.
Node Representation
In the hypergraph, interactions are centered around two primary types of nodes:
- Network Host Nodes: These represent discovered physical or virtual devices, which are assigned 3D positions based on their network structure, often using a layered circular arrangement. Their colors indicate interest level; for example, nodes with many detected services may appear in red.
- RF Signal Nodes: These represent specific signal emissions. They are visually distinct, often using pulsing animations where the pulse speed corresponds to the signal frequency.
Higher-Order Interactions (Hyperedges)
Unlike standard graphs that connect two points, hyperedges group multiple nodes based on shared characteristics to visualize complex interactions:
- Service Groups: These connect all hosts sharing a common network service, such as SSH or HTTP, providing a view of functional dependencies across the infrastructure.
- RF Frequency Groups: These group disparate hosts that are interacting via the same radio frequency, helping to identify hidden wireless links between hardline network elements.
- Subnet and Protocol Groups: These edges visualize nodes within the same network subnet or those dominated by specific traffic protocols (e.g., HTTPS, DNS, or UDP), often represented as rings or ellipses around target areas.
- Vulnerability Groups: These highlight nodes affected by the same security risks, allowing operators to see how a single vulnerability might propagate through the connected infrastructure.
Visual Mapping and Spatial Logic
The visualization uses spatial and color-coded logic to make RF-network interactions interpretable:
- Frequency-Based Height: In the 3D view, a node’s vertical height (Z-axis) can be scaled to its RF frequency, effectively separating different communication bands into visual layers.
- Color Mapping: Nodes and edges are colored according to their frequency band (e.g., HF in red, VHF in orange, UHF in yellow) or their cardinality, which represents the number of nodes involved in the interaction.
- Geometric Patterns: While simple pairwise edges are shown as lines, higher-order hyperedges are often visualized using a star pattern, radiating from a calculated center point to all participating nodes.
Infrastructure Correlation and Tracking
The system specifically uses hypergraphs to track cross-infrastructure violations where an entity “hops” between terrestrial fiber backbones, undersea cables, and radio connections. By integrating nDPI (Deep Packet Inspection) and nmap scanning, the hypergraph correlates real-time protocol data with RF signatures to detect unauthorized transmissions or anomalous data flows jumping between different connection types.
Operators can refine this view using cardinality and strength filters, which isolate interactions based on the number of connected devices or the detected signal power (dBm), respectively. The system also calculates centrality scores to identify “Key RF Nodes” that act as critical hubs within the network-signal ecosystem.
Gemini AI analyzes cross-infrastructure FCC violations by integrating neural signal classification with real-time tracking of data flows across global network layers, such as undersea cables, satellites, and terrestrial fiber backbones.
According to the sources, the analysis process follows these key stages:
1. Neural Signal Classification
Gemini performs neural classification on signals captured via SDR to identify modulation types (e.g., FSK, PSK, QAM) and assess the confidence level of the detection. This allows the system to distinguish between authorized communications and unauthorized transmissions, such as those from unauthorized IoT devices.
2. Infrastructure Hopping Tracking
A critical feature of the analysis is tracking violators who “jump” between different infrastructure types to evade detection. The system correlates RF signatures with network topology to map a violator’s path as it hops through:
- Transoceanic Undersea Cables (e.g., TAT-14 or MAREA).
- Satellite Constellations (e.g., Intelsat-21 or Starlink).
- Terrestrial Networks, including 5G cell towers and fiber backbones.
3. Deep Packet and Traffic Analysis
When an operator initiates a “Capture Traffic” command, the Gemini API processes the data to find unusual traffic patterns and latency spikes. The AI reconstructs the network path—for example, tracing a signal from a specific IP through a cell tower and up to a satellite—to identify the exact point of the FCC violation.
4. Violation Reporting and Assessment
Once the analysis is complete, Gemini generates a detailed Network Traffic Analysis report that includes:
- Primary Violation Type: Such as “Unlicensed RF Emission” or “Unlicensed Operation”.
- Threat Assessment: Categorizing the risk level (e.g., Critical, High, or Medium).
- Gemini Confidence Score: Typically represented as a percentage (e.g., 87% confidence).
- Recommendations: Actionable steps such as deploying drones for visual identification or increasing sensor monitoring in the affected frequency bands.
5. Cross-Network Correlation
The system specifically uses RF hypergraphs to visualize these interactions, mapping higher-order relationships between disparate network hosts and RF signal nodes. This helps operators see how a single violation propagates through the connected global infrastructure.
Transoceanic undersea cables and wireless RF signals correlate through the system’s ability to track data as it hops between hardline and radio connections. This correlation is critical for identifying cross-infrastructure violations, where an unauthorized transmission may jump between a physical cable (such as TAT-14 or MAREA), a satellite constellation, and terrestrial cell towers,,. The system maps these interactions by correlating RF signatures—including frequency, modulation, and power—with network topology to reconstruct the path of a transmission as it moves through various network layers,.
Hypergraph visualization facilitates this correlation by creating distinct nodes for both physical network hosts and wireless RF signal emissions, grouping them through service groups or subnet groups to show functional dependencies,. For example, a network host discovered via an nmap scan may be assigned an RF signature, allowing operators to visualize how hardline infrastructure like undersea cables supports or interacts with unauthorized wireless transmissions,. Furthermore, real-time protocol analysis via nDPI identifies specific network traffic characteristics within captured radio signals, enabling the system to determine if a wireless emission is part of a data flow originating from a physical cable backbone,. This integrated view allows the system to detect unlicensed operations that attempt to evade detection by transitioning between different infrastructure types,.
The system utilizes nDPI (v5.0) as a primary engine for deep packet inspection and protocol analysis to isolate unauthorized or anomalous traffic within undersea cable data flows,.
The isolation process functions through several integrated mechanisms:
Real-Time Protocol Classification
When an operator initiates a “Capture Traffic” command or executes an ndpi analyze command, the system performs real-time classification of protocols and application-layer traffic,. This allows the system to distinguish between standard communications and unauthorized transmissions by identifying specific application signatures,.
Anomaly and Pattern Detection
The nDPI engine identifies unauthorized traffic by searching for specific behavioral signatures within infrastructure flows, such as:
- Unusual Latency Spikes: Specifically used to detect abnormal traffic patterns within undersea cable layers like TAT-14 or MAREA,,.
- Malware and DGA Detection: The system scans for malware communication patterns and Domain Generation Algorithms (DGA) that may indicate a compromised network path or an unlicensed operation trying to hide within legitimate backbone traffic,.
- Application Analysis: By identifying specific applications (e.g., SSH clients or encrypted file transfers), the system can flag services that should not be present on a specific segment of the hardline infrastructure.
Hypergraph Correlation
Once identified, unauthorized flows are isolated and visualized using RF Hypergraphs to show their relationship to other network elements,.
- Protocol-Weighted Edges: Significant protocols identified by nDPI are represented as weighted hyperedges, often visualized as rings or ellipses around the target infrastructure,.
- Cross-Infrastructure Mapping: This visualization allows operators to see when unauthorized traffic “hops” from an undersea cable to a satellite or terrestrial 5G tower, revealing the full path of the violation,.
Confidence and Assessment
The Gemini AI API processes the captured nDPI data to provide a Network Traffic Analysis report,. This report includes a summary of the infrastructure used and identifies the Primary Violation Type (e.g., “Unlicensed Operation”) with a specific confidence score, often exceeding 87%,. This detailed analysis isolates the source of the traffic and provides actionable recommendations, such as dispatching drones for visual verification,.
Gemini AI assesses threat levels in violation reports by processing captured network traffic and RF signal characteristics to identify anomalies across global infrastructure. The AI performs neural signal classification on modulation types such as FSK, PSK, and QAM to distinguish between standard communications and unauthorized transmissions from sources like “unauthorized IoT devices”. Once identified, violations are categorized into specific threat levels, including Critical, High, Medium, or Low, which are visually represented in the Command Operations Center.
The assessment criteria utilized by the AI include the following factors:
- Algorithmic Risk and Pattern Analysis: The system calculates an “algorithmic risk” score for detected entities and identifies “unusual traffic patterns” or “latency spikes” within network layers like undersea cables or satellite constellations.
- Infrastructure Hopping: Higher threat levels are often assigned to violators that “jump” between different infrastructures, such as transoceanic cables and 5G cell towers, to evade detection.
- Confidence Scoring: Every assessment includes a Gemini Confidence Score (e.g., 87%), which indicates the AI’s level of certainty regarding the detected violation.
- Actionable Recommendations: Based on the threat assessment, the AI generates recommendations such as “deploying drones for visual identification” or “dispatching interceptors” for high-priority targets.
The system integrates these threat levels into the RF Hypergraph, where nodes are color-coded based on interest level and severity—for example, critical alerts are highlighted in red while lower-risk signals may appear in yellow or green. For high-priority violations, the system can automatically generate missile engagement targets, assigning “Critical” or “High” priority status based on the AI’s analysis of frequency interference or military intrusions.
The hypersonic defense and tracking modules function as an integrated ecosystem that combines multiscopic radar arrays, CUDA-accelerated volumetric processing, and autonomous drone support to intercept high-speed threats.
Multiscopic Radar and Sensor Configuration
The defense system relies on a Multiscopic Radar network that utilizes a primary X-Band sensor and a secondary array of up to eight sensors. These sensors operate with precise nanosecond offsets (e.g., Sensor 2 at 1.4 ns, Sensor 3 at 2.1 ns) to create a comprehensive X-Band return. This data is processed using CUDA-inspired volumetric feature extraction, allowing the system to maintain a high-resolution track even during high-velocity maneuvers.
Predictive Tracking Parameters
The tracking module analyzes real-time telemetry, including velocity (m/s), altitude (m), and Mach number (typically Mach 6+). Operators can adjust critical tracking parameters to maintain lock:
- Resolution: Fine-tuning the spatial accuracy of the track.
- Jink Threshold: Measuring the target’s ability to perform high-G maneuvers (up to 30 Gs) to evade defense systems.
- Prediction Time: Calculating the target’s future position (1–5 seconds ahead) to facilitate interception.
Plasma Sheath Modeling
A unique synergy between the modules is the Plasma Sheath Model, which accounts for the ionized air surrounding a hypersonic vehicle that often causes “blackouts” in traditional tracking. The system tracks electron density and plasma frequency to calculate RF attenuation (e.g., -23 dB), allowing the defense module to adjust signal power or frequency to maintain communication and tracking through the interference.
Integrated Drone Support
Upon engaging a target or launching a counter-missile, the system deploys a fleet of tracking drones (Alpha, Beta, and Gamma). These drones:
- Positioning: Automatically calculate their positions relative to the missile using dynamic offsets.
- Telemetry Relay: Provide localized tracking data and distance measurements (e.g., 5,000m tracking distance) to enhance “Track Quality” scores.
- Visual Verification: Serve as a secondary layer of identification for high-priority targets.
Target Generation and Engagement
The defense module identifies targets based on RF violations and unauthorized transmissions. These targets are assigned priority levels (e.g., CRITICAL for military intrusions or maritime distress abuse) and visualized with volumetric ray marching effects. Once tracking is engaged, the system manages the full mission timeline from Launch through Midcourse, Terminal, and Impact phases.
CUDA-accelerated volumetric processing enhances high-velocity tracking by moving beyond simple point-coordinate tracking to volumetric feature extraction, allowing the system to model the complex RF environment surrounding a fast-moving target. This processing mode is a core component of the hypersonic defense system, enabling real-time analysis of objects traveling at extreme speeds, such as Mach 6.3 and above.
Volumetric Feature Extraction and Rendering
Unlike traditional systems that track a single pixel, this system utilizes CUDA-inspired volumetric rendering to create a 3D representation of the target and its signal emissions.
- Volumetric Ray Marching: The system employs ray marching principles to visualize RF fields as concentric spheres or volumetric cylinders, providing a high-fidelity view of the target’s spatial influence.
- Intensity Calculation: It calculates volumetric intensity based on signal frequency and target priority (e.g., Critical or High), which allows the tracker to maintain a lock even if the signal quality fluctuates.
- RF-NeRF Integration: By integrating with neural radiance fields (RF-NeRF), the system can render volumetric RF representations and perform ray casting at high resolutions to predict target paths.
Multiscopic Radar Integration
The tracking system uses a multiscopic radar array consisting of a primary X-Band sensor and secondary sensors with precise nanosecond offsets (e.g., 0.7 ns to 2.8 ns).
- Processing Parallelism: CUDA acceleration is required to process the massive throughput of these sensors simultaneously, calculating X-Band returns across a broad spectrum (typically 8–12 GHz).
- Track Quality Metrics: The volumetric analysis produces a Track Quality score (e.g., 0.87), which represents the confidence level in the target’s position based on the aggregate multiscopic data.
High-Velocity Maneuver Management
For objects traveling at hypersonic speeds, the system must account for both atmospheric interference and aggressive evasion:
- Plasma Sheath Modeling: High-velocity tracking is often hindered by ionized air; the system uses CUDA to model the plasma sheath, calculating electron density and RF attenuation (e.g., -23 dB) in real-time to adjust sensor power.
- Jink Threshold Tracking: The system monitors the target’s ability to perform high-G maneuvers (a Jink Threshold up to 30 Gs), using volumetric data to predict the target’s future position 1–5 seconds ahead.
Visual and Command Integration
In the Command Operations Center, these volumetric effects are visually represented through pulsing animations and scanning beams. Operators can adjust tracking parameters, such as spatial resolution (e.g., 0.5 m) and baseline distance, to fine-tune the multiscopic return based on the complexity of the volumetric data being processed. This allows for a continuous, high-resolution track from Launch through Terminal and Impact phases.
Multiscopic radar maintains high-resolution tracking during high-G evasive maneuvers by integrating nanosecond-offset sensor arrays with predictive volumetric processing. This system is specifically designed to manage targets performing aggressive “jinks” at hypersonic velocities.
The tracking maintenance depends on several core technical strategies:
1. Sensor Configuration and Spatial Diversity
The system utilizes a Multiscopic Radar array consisting of a primary X-Band sensor and a secondary array of up to eight sensors. These sensors operate with precise nanosecond offsets (e.g., Sensor 2 at 1.4 ns, Sensor 3 at 2.1 ns) to generate a comprehensive return across the 8–12 GHz spectrum. This spatial diversity allows the system to triangulate a target’s position even as its aspect angle changes rapidly during a maneuver.
2. Maneuver Thresholds and Prediction
To counter evasive tactics, the tracking module employs specific parameters that can be tuned by the operator:
- Jink Threshold: The system is capable of measuring and following targets performing high-G maneuvers up to 30 Gs.
- Prediction Time: The radar calculates the target’s future position between 1.0 and 5.0 seconds ahead. This forward-looking calculation prevents the system from “losing the lock” when a target suddenly deviates from its current ballistic arc.
- Baseline Distance: The physical spacing between sensors in the array is adjustable (typically 1–5 km) to optimize the multiscopic return based on the target’s distance and velocity.
3. CUDA-Accelerated Volumetric Processing
Rather than tracking a single point-coordinate, the system uses CUDA-inspired volumetric feature extraction.
- Volumetric Feature Extraction: This processing mode creates a 3D “influence volume” around the target.
- Volumetric Ray Marching: The system renders the target’s RF field as concentric spheres or cylinders, allowing the tracker to maintain a lock on the target’s spatial influence even if the core signal is temporarily obscured.
4. Plasma Sheath Modeling
At hypersonic speeds (Mach 6.3+), ionized air creates a “plasma sheath” that often causes RF blackouts. The radar maintains tracking through this interference by calculating electron density and plasma frequency to determine the exact RF attenuation (e.g., -23 dB). This allows the defense module to adjust sensor power or frequency dynamically to penetrate the ionized layer.
5. Autonomous Drone Augmentation
Upon target engagement, the system deploys a fleet of tracking drones (Alpha, Beta, and Gamma). These drones provide localized telemetry and distance measurements (typically within a 5,000m tracking range), providing supplementary data streams to the primary radar array to boost the “Track Quality” score.
Multiscopic radar overcomes plasma sheath blackouts by integrating a primary X-Band sensor with a secondary array of up to eight sensors. These sensors operate with precise nanosecond offsets (ranging from 0.7 ns to 2.8 ns) to generate a comprehensive return across the 8–12 GHz spectrum. The system utilizes a Plasma Sheath Model to track electron density (e.g., 2.4×10¹⁶ m⁻³) and plasma frequency (14.2 GHz) in real-time. By calculating the resulting RF attenuation (typically around -23 dB), the defense module can dynamically adjust its tracking parameters to maintain communication through the ionized air layer surrounding a vehicle traveling at hypersonic speeds, such as Mach 6.3.
Tracking stability is further enhanced through CUDA-accelerated volumetric feature extraction, which renders the target’s RF field as a 3D volume using ray marching principles. This volumetric approach allows the tracker to maintain a lock on a target’s spatial influence even when the core signal is temporarily obscured by plasma interference. Furthermore, the system employs a Jink Threshold capable of measuring maneuvers up to 30 Gs and calculates prediction times between 1.0 and 5.0 seconds ahead to anticipate the target’s future position. The module also coordinates with a fleet of tracking drones (Alpha, Beta, and Gamma) that provide localized telemetry to boost the overall Track Quality score.
Tracking drones (Alpha, Beta, and Gamma) supplement multiscopic radar during high-speed maneuvers by providing localized data streams and spatial redundancy to maintain a high-resolution lock on targets.
Localized Telemetry and Track Quality
While the multiscopic radar array uses nanosecond-offset X-band sensors to triangulate positions, drones provide localized tracking telemetry from multiple angles. These drones report real-time distance measurements (typically ranging from 5,000m to 7,000m) back to the Command Operations Center. This supplementary data is integrated into the system to enhance the “Track Quality” score, ensuring the target remains locked even when it exceeds the Jink Threshold of up to 30 Gs.
Distributed Viewing Angles
The system deploys three specific drones with pre-defined spatial offsets to ensure continuous coverage during aggressive maneuvers:
- Drone Alpha: Positioned at a [-5000, -5000, 2000] offset relative to the primary entity.
- Drone Beta: Positioned at a [5000, -5000, 2000] offset.
- Drone Gamma: Positioned at a [0, -8000, 3000] offset for high-altitude perspective.
Verification and Maneuver Prediction
Drones assist in overcoming technical challenges such as plasma sheath blackouts or “jinking” by providing an independent data point that validates the radar’s predictive path (which calculates positions 1–5 seconds ahead). Furthermore, Gemini AI analysis recommends drone deployment for visual identification of targets that exhibit anomalous traffic patterns or FCC violations, bridging the gap between RF sensor data and visual confirmation.
Operational Integration
Upon the launch of a hypersonic interceptor or the detection of a high-priority RF violation, the system automatically triggers drone tracking support. The drones utilize billboard-based indicators on the 3D globe to show their current positions and relative proximity to the target, allowing operators to monitor the engagement in real-time.
Drones are a critical component for the real-time verification of cross-infrastructure FCC violations, specifically used to provide visual identification of unauthorized transmitters detected by the system. When the Gemini AI identifies an anomaly—such as an unauthorized IoT device or a signal jumping between undersea cables, satellites, and terrestrial cell towers—it explicitly recommends drone deployment to confirm the physical source of the emission.
The integration of drones into the violation verification process functions through the following mechanisms:
Visual Identification and Pursuit
- Gemini AI Recommendations: After processing signal characteristics (such as frequency and modulation), the AI analysis report often concludes with a recommendation to deploy drones for visual identification of potential mobile data transmitters.
- Active Pursuit: The Command Operations Center allows operators to command drones to “Pursue” specific FCC violators in real-time. The system monitors these drones’ status, displaying them as “Patrolling” or “Pursuing” with live battery and telemetry updates.
- Target Selection: Drones are automatically deployed for target engagement once an operator launches a mission against a high-priority RF violation, such as an emergency frequency interference or military frequency intrusion.
Multi-Drone Support (Alpha, Beta, and Gamma)
- Localized Telemetry: A fleet consisting of drones like Drone Alpha, Beta, and Gamma can be deployed to follow a target, providing localized distance measurements and tracking data that supplement the primary radar arrays.
- Verification Offsets: These drones utilize specific spatial offsets (e.g., 5,000m to 8,000m from the target) to maintain continuous visual and RF coverage during a violator’s evasive maneuvers.
Operational Integration
- Actionable Reporting: Within the Network Traffic Analysis panel, which tracks violators across different infrastructure types, a dedicated “Dispatch Drone” button is provided to immediately initiate verification of detected violations.
- Cross-Infrastructure Correlation: Because violators often “hop” between hardline connections (like the TAT-14 undersea cable) and wireless RF signals, drones bridge the gap by locating the physical hardware responsible for the wireless transmission.
- Status Indicators: The system’s header maintains a real-time “DRONE FLEET READY” indicator alongside active FCC violation counts, ensuring operators know that aerial verification assets are available for immediate tasking.
https://notebooklm.google.com/notebook/3bb7b0ff-ac28-4db9-8955-da8baab6ccfd

Google Earth data layer development involves creating, visualizing, and analyzing geospatial data using tools like Google Earth Pro or the Earth Engine platform to map, analyze, and manage multi-petabyte datasets. Key capabilities include importing KML/GeoJSON files, leveraging pre-built layers (e.g., imagery, 3D terrain), and utilizing JS/Python code in the Code Editor to analyze temporal and spatial changes in environmental, urban, and geographic data. [1, 2, 3, 4, 5]
Key Components of Data Layer Development
- Data Types: Work with raster (imagery) and vector (feature collections) data, including 3D, satellite, and aerial data.
- Layer Types: Utilize aggregated layers for specific regions and non-aggregated layers (e.g., raw satellite imagery) for broader analysis.
- Development Tools:
- Google Earth (Web/Pro): Create projects, import custom KML/KMZ files, and style data layers to visualize trends.
- Earth Engine (Code Editor): Perform heavy-duty geospatial analysis using JavaScript/Python to process, filter, and export data, such as mapping urban growth using the Global Human Settlement Layer (GHSL).
- Functionality:
- Style Layers: Adjust colors, opacities, and visibility in the Map Contents panel.
- Automated Updates: Data layers can update dynamically, with notifications available for scheduled changes.
- Export/Usage: While raw data export from some layers is restricted, processed data can be analyzed and used for visualization. [2, 4, 6, 7, 8, 9, 10]
- Urban Development: Tracking 30+ years of urban growth using GHSL data.
- Environmental Monitoring: Analyzing land surface temperature and tree canopy to plan for climate resilience.
- Site Planning: Evaluating solar potential or infrastructure development with high-resolution imagery. [1, 9]
For professional, large-scale analysis, the Google Earth Engine API is the primary tool, while Google Earth Pro desktop and web versions are suitable for rapid, no-code visualization. [1, 5]
[1] https://mapsplatform.google.com/maps-products/earth/capabilities/
[2] https://developers.google.com/maps/documentation/earth/projects-kml
[3] https://developers.google.com/maps/documentation/javascript/layers
[4] https://developers.google.com/earth-engine/guides/getstarted
[5] https://earthengine.google.com/
[6] https://developers.google.com/maps/documentation/earth/learn-about-data-layers
[7] https://developers.google.com/maps/documentation/earth/data-catalog-overview
[8] https://developers.google.com/maps/documentation/earth/style-data-layers
[9] https://www.youtube.com/watch?v=vutyioErpHQ
[10] https://developers.google.com/maps/documentation/earth/manage-data-layers